VCGI is pleased to announce the availability of a normalized digital surface model (nDSM) throughout Vermont. The nDSM is the last product to be produced and published from the statewide QL2, 0.7-meter resolution lidar collections performed between 2013 and 2017, and reflects the height of features (e.g. buildings, trees) above ground at the time of collection.
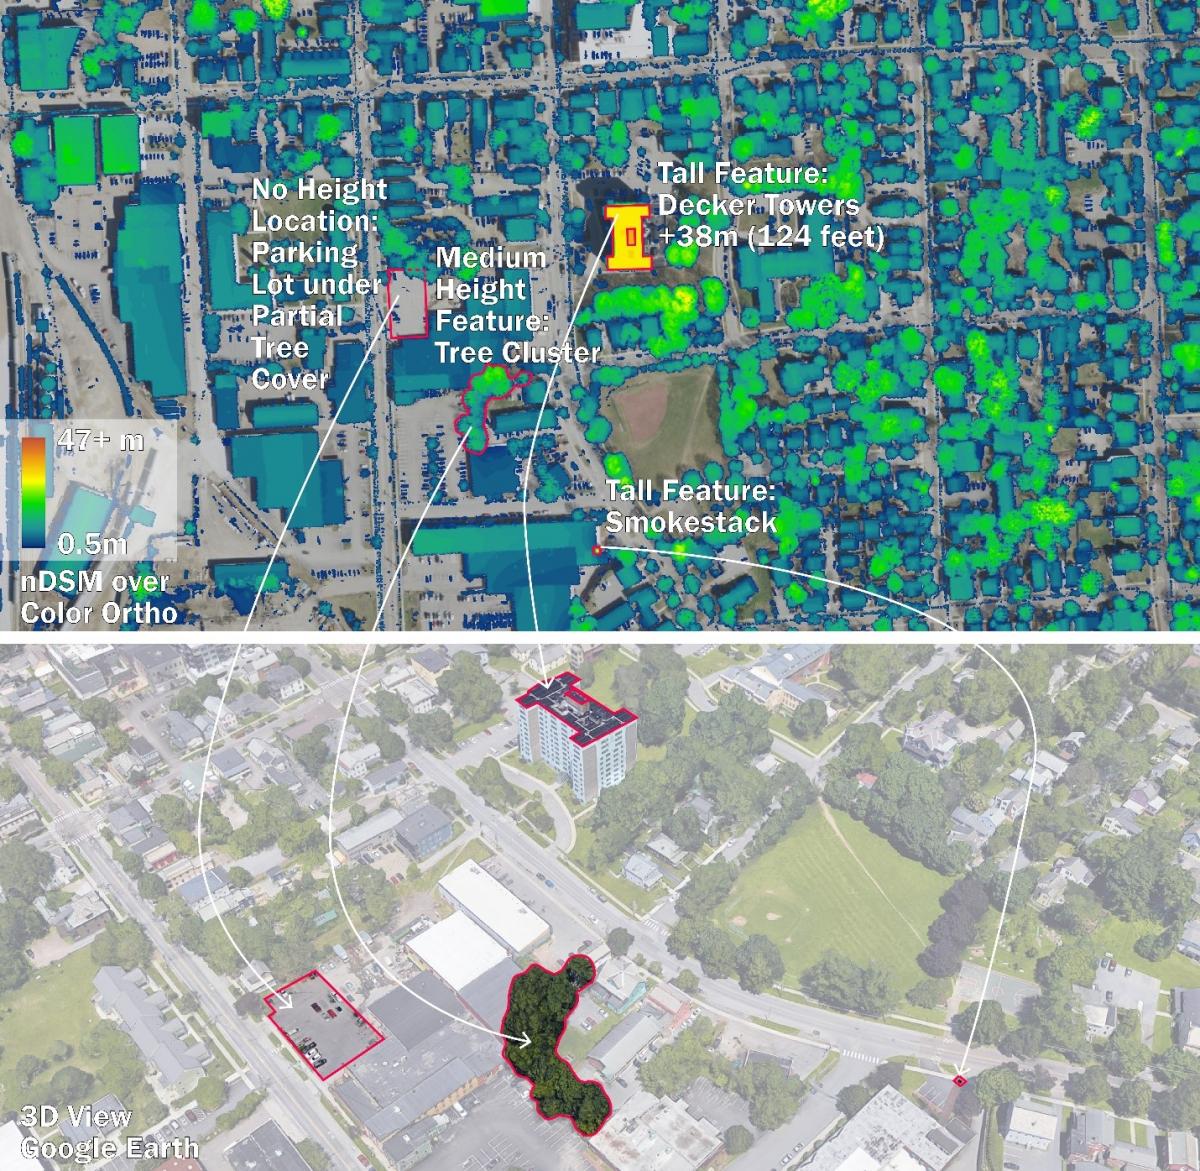
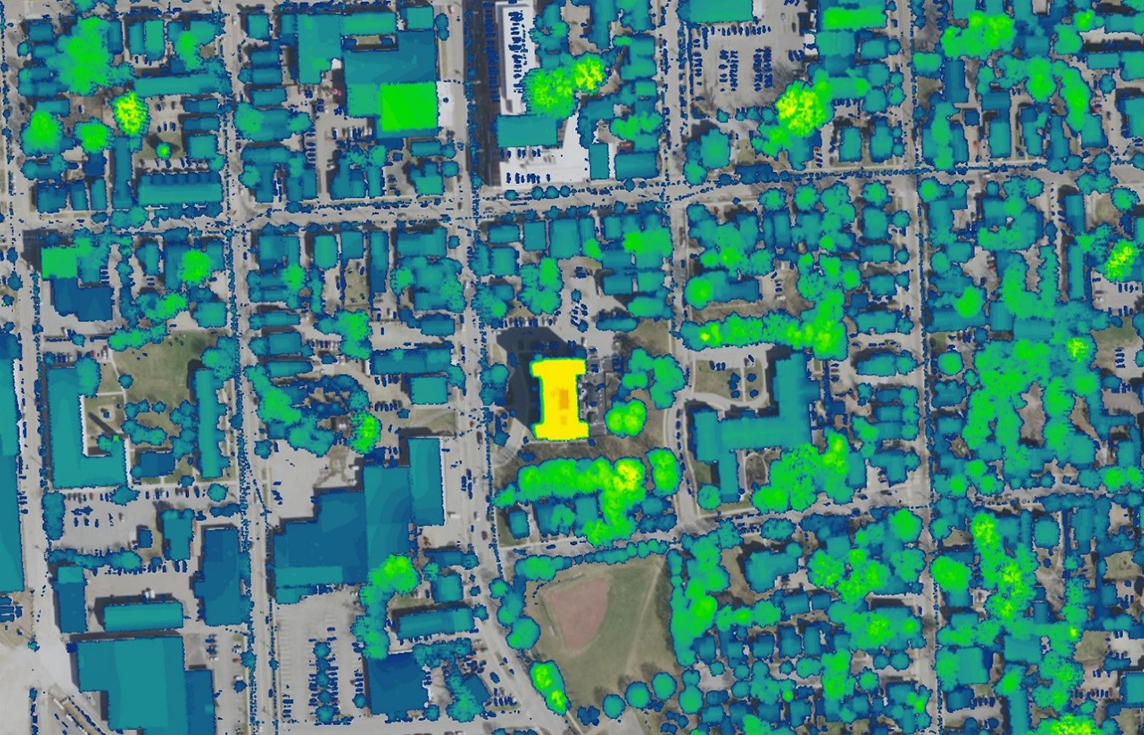
Four locations, four different heights. The top image displays the nDSM overlaid on an orthophoto, whereas the oblique view in the bottom image displays those same four locations in Burlington with a sense of their height as depicted in Google Earth’s 3D photogrammetry. The nDSM service in the top image is symbolized to display objects that are 0.5 meters to 47+ meters above ground. Taller objects are yellow to orange, shorter objects blue to green. Areas where there is no above ground elevation (e.g. parking lot), are not within the nDSM layer.
Put simply, the nDSM depicts the difference between the digital surface model (DSM)—which reflects the highest points of objects (tops of structures, vegetation)—and the digital elevation model (DEM), which reflects the underlying “bare earth”. The resulting nDSM layer thus represents only those objects with heights above the ground, and not the ground itself. As with all of VCGI’s published lidar-derived products, the source data used to create the nDSM have been gathered at different times and in different locations, normalization (the n in nDSM) is employed to create as close to a seamless, uniform statewide layer as possible. The result is a layer useful for multiple cartographic and analytical purposes.
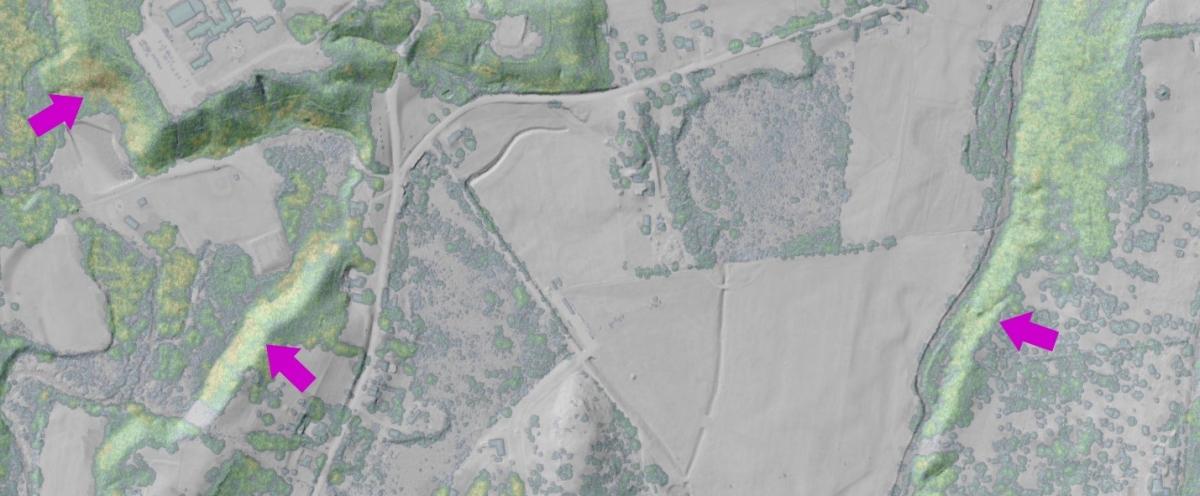
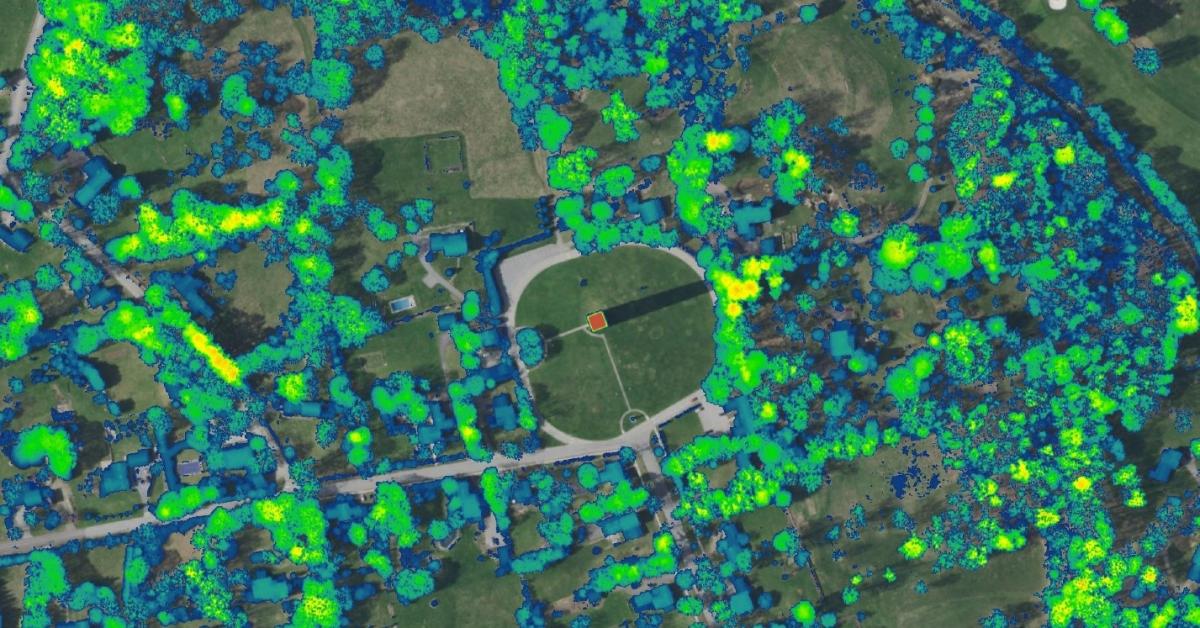
Looking closely at the nDSM in relation with the bare earth hillshade and other elevation layers reveals interesting patterns and relationships. In the Pittsford, VT example above and below, taller stands of trees appear to coincide with sloped areas that may be undisturbed, nestled among other residential, recreational, agricultural, and institutional land uses:
 A challenge with producing a normalized statewide layer of this kind pertains to representing extremes at the short and tall ends of the height spectrum. In the nDSM service, short features less than 0.5m (1.6’) in height are invisible, whereas tall features greater than 47m (154.2’) are represented as a single max value within the published service’s color ramp and are all shown in deep orange. This means that tall features, such as the Bennington Battle Monument shown below, appear visually the same as other features that are also greater than 47 meters above ground yet are of different heights. Still, out of 52 billion lidar points collected statewide, only 0.01% fall “out of range” here given the 0.5-47m display of the nDSM service layer. Users may still refer to the downloadable tiles of the nDSM to both see and use the full range of heights for any given point statewide.
One of the more obvious features to spot in the nDSM: The Bennington Battle Monument (93m / 306’).
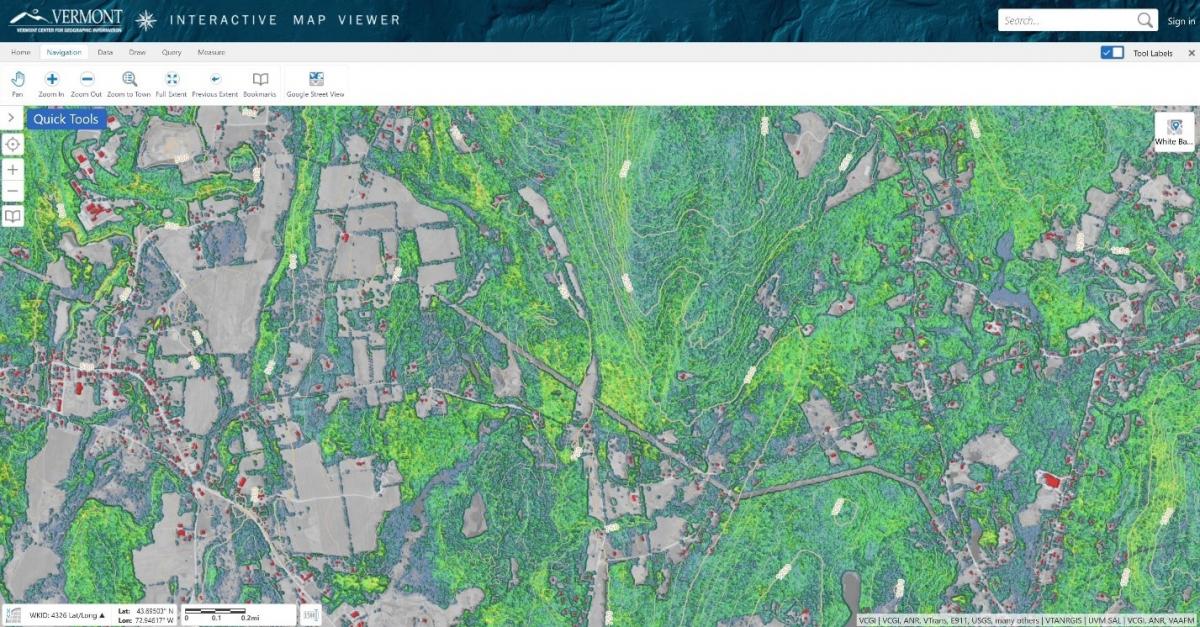
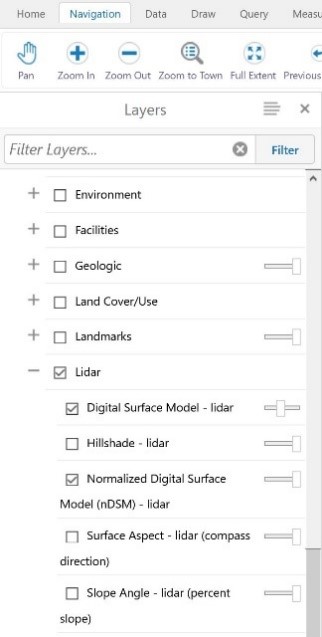
The nDSM layer is available from the VT Lidar Finder and Vermont Open Geodata Portal as tiles for data download organized by collection year, a stream-able statewide service projected in web mercator for web map use, and as a pre-loaded layer within the Vermont Interactive Map Viewer for easy viewing access.
Usage Notes and Caveats
A few important considerations for advanced users of the nDSM:
- The web service is cached from level 05 through level 18 (1:2,256), with cache-on-demand availability of level 19 (1:1,128). Zooming in to level 19 may result in a brief delay for returning the area of interest when viewed for the first time.
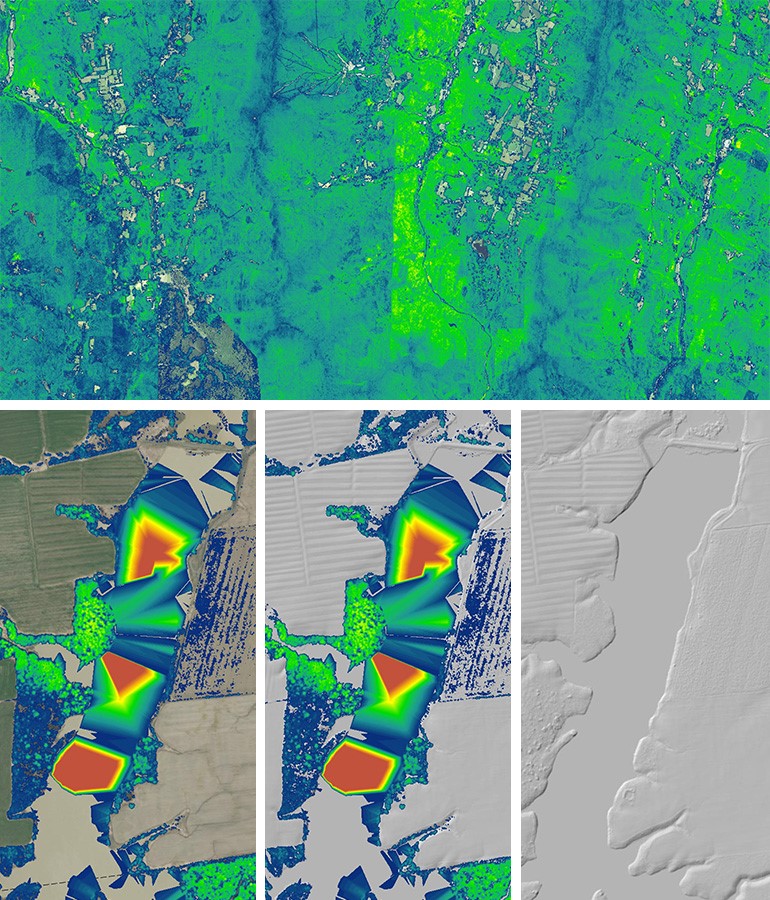
- Certain areas and features display in odd ways due to limitations of the source DSM data. These include non-hydro flattened DSMs (e.g. Riverways) and abutting edges of different flight line capture dates (see example images below), and other non-filtered DSM point data.
- VCGI has performed a statewide analysis on out-of-range values – reach out if you think extreme height features may have bearing on your work and use of the nDSM.
- The height of a feature at specifc point/pixel (for objects 1 to 47 meters tall) is technically possible to access from the raster image service, provided you are an ArcGIS user. If needed, see this explanation of how to do so.
- Easier still, our friends at ANR have developed a web app titled "What's My Elevation?" that calls the nDSM and other lidar-derived services and allows one to easily find both their elevation on the ground (above sea level) and the height of a particular feature at a select location:
For more information about the nDSM or other lidar-derived elevation products, see VCGI’s lidar program page.
###